Natural gas producers reacting quickly to demand/price changes

By Jeff Bolyard, Principal, Energy Supply Advisory
This post is featured in our July 2024 Monthly Monitor, which includes articles and analysis for the natural gas, electric, crude oil, and sustainability markets. To read the full report and sign up for the Monthly Monitor distribution list, click here.
A second consecutive winter where the U.S. experienced warmer-than-normal temperatures was not the most opportunistic time for natural gas producers to reach all-time highs in production. Dry gas production peaked on February 7, 2024, at 106.1 Bcf, primed for what the heart of winter had to throw at it. What was delivered was a winter that was much warmer than normal.
Heating demand, particularly in the residential and commercial sectors (res/comm), is influenced greatly by winter weather. For the winter period of November 2023-March 2024, which included the very cold, high-usage month of January, the res/comm sectors used an estimated 246.7 Bcf less than the previous winter of 2022/2023. As my Economics 101 professor in college would say, “Absent outside influence, an increase in supply combined with a decrease in demand will result in lower pricing for a commodity.”
In the case of natural gas pricing, this is what occurred. In February, when production reached all-time highs (increase in supply) along with a coinciding drop in res/comm demand due to abnormally warm weather (decrease in demand), pricing was destined to fall - and it did.
In January 2024, spot pricing on the benchmark Henry Hub averaged ~$4.00/MMBtu. As the oversupply situation worsened in February, prices dropped to an average of ~$1.75/MMBtu, falling to ~$1.50 in March, and not faring much better in April. Producers reacted to this rock-bottom pricing by reducing production.
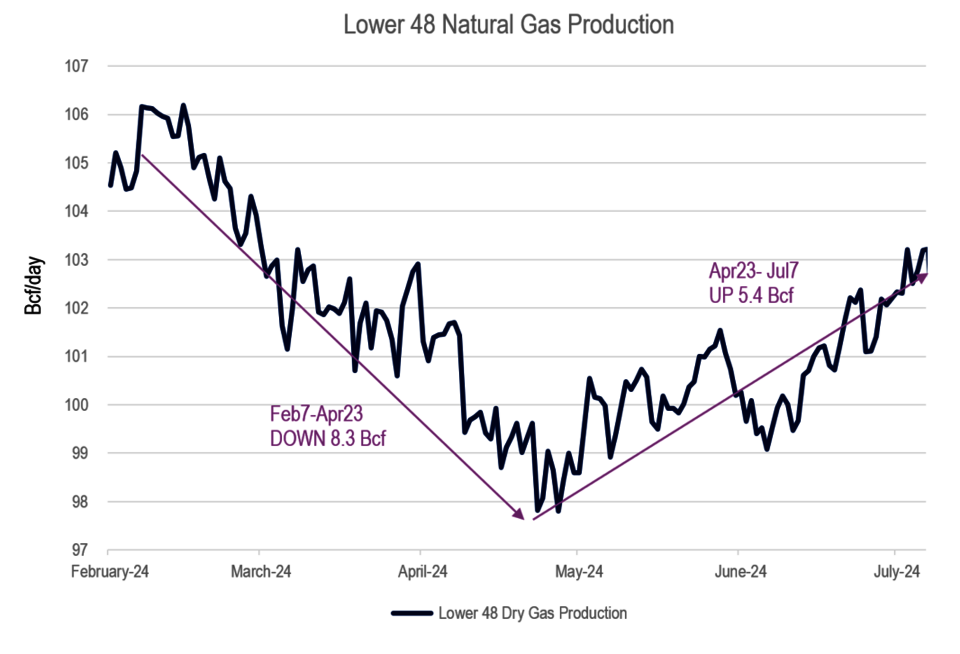
The chart below reflects the dry gas production in the lower 48 states from February through June 2024. As gas pricing deteriorated, so did production. Dry production in early February was humming at over 106 Bcf per day (left side) but fell by 8.3 Bcf per day to a low point of 97.8 Bcf on April 23, 2024 (middle of chart).

Extremely hot weather arrived in June and brought with it 40.4 Bcf per day of natural-gas-fired generation demand. With production down and demand up, the storage surplus shrank, and prices turned around. From early June to early July, cash prices rose nearly $1/MMBtu from the lows of March/April.
This is the point at which the newfound ability of the modern dry gas producer comes into play. From the low point of production on April 23 until July 7, producers were able to turn previously- curtailed production back into the market by a staggering 5.4 Bcf per day (far right on chart). Just a few years ago, most thought it would be detrimental - even catastrophic - to the future production of a well to curtail or interrupt the flow of gas from it.
It is a new day in the gas market, and it’s now obvious that producers have both the physical ability and intestinal fortitude to quickly reduce or increase significant amounts of natural gas supply in reaction to gas prices. Absent a fundamental change in the market conditions evident today, additional production could still come online quickly should prices facilitate turning on the spigot. Likewise, should prices decline again, it is also likely that production could follow suit, and with this new producer-controlled dynamic will come higher price volatility.
