It’s complicated: Rig count impact on future natural gas production

By Jeff Bolyard
Each month, Trio monitors several variables that impact natural gas prices in current and future markets. Fundamentals that impact pricing include extreme weather conditions and natural gas consumption trends by each of the major usage classes (residential & commercial, industrial, and power generation). Other variables contributing to variations in short and long-term prices include the status of storage inventories compared to historic levels, global geopolitical events, and even election results in the U.S. and abroad.
However, one historical gauge of future energy prices has changed since the shale revolution took over in the 2020s: the weekly drilling rig count. This count had traditionally been a measuring stick for future production. If there’s an increase in the number of natural gas rigs, the logical conclusion would seem to be that there’d be increased natural gas production 9-18 months down the road. Yet, predicting future natural gas production is not as clear-cut anymore, as the general rig count total can be misleading if it is the only metric being measured.
The Baker Hughes weekly rig count for the week ending 10/11/2024 reported 586 active drilling rigs in the U.S. If we break that rig count down into the six production regions across the U.S. and apply the historical production of natural gas from the Energy Information Administration’s (EIA) STEO report out of each of those regions, we can then begin to piece together how much natural gas might be produced by each of the regions in the first year of production when the current regional rig count is multiplied by that historical production performance.

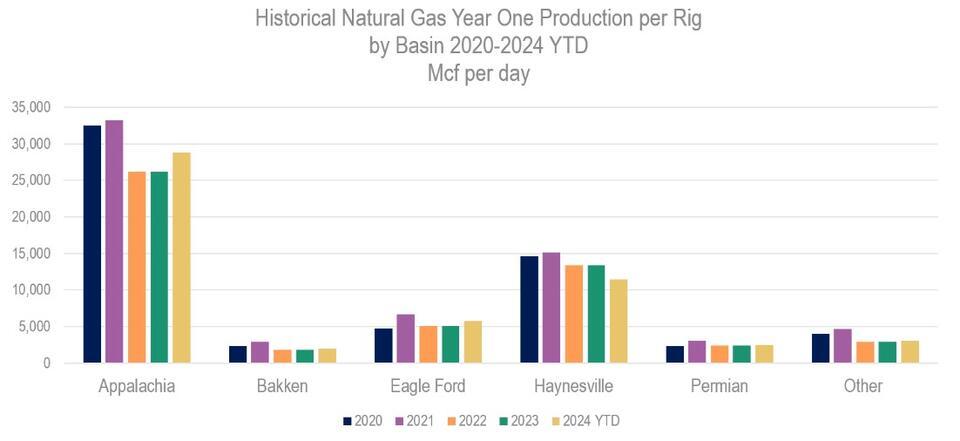
The chart above shows the historical regional production trends per rig from 2020-2023 and 2024 YTD based on data from the EIA. It’s easy to see that Appalachia is the most productive region for natural gas per drilling rig. In the past four and a half years, each drilling rig in this region averaged 29,364 Mcf per day of natural gas in year one of turning them in line. Turning in line (TIL) means production is turned on for use by the market rather than putting a lid on the well and waiting for either a pipeline connection to be built or prices to rise.
The Haynesville basin is the next largest gas producing region per rig, averaging 13,588 Mcf/day per drilling rig, which is still less than half of the average Appalachian volume. Meanwhile, the Permian region, which focuses on oil economics, produces an average of just 2,577 Mcf/day per rig.
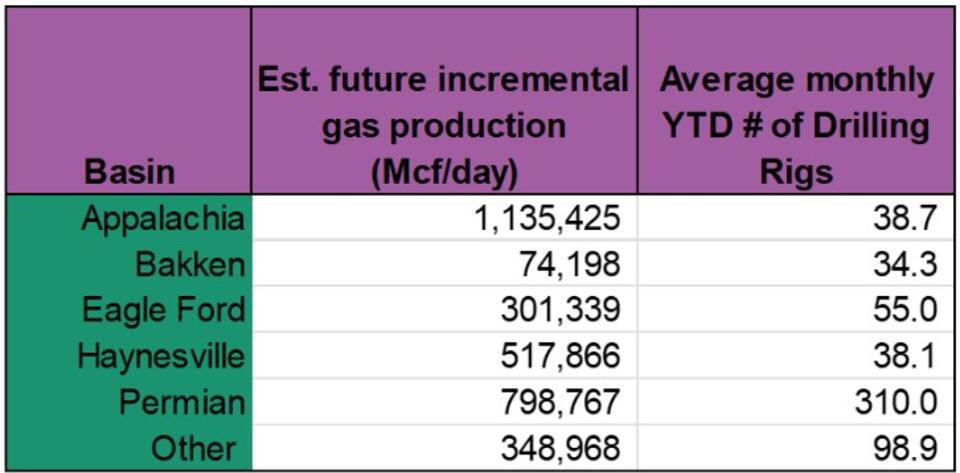
From this EIA production data, we applied the YTD average drilling rig count to each basin for an idea of new natural gas production that might be coming from each basin over the next 9-18 months based on current rig counts. Of course, this incremental volume will be significantly offset by legacy well production decline as older wells decrease over time, but we can get an idea of which regions will likely be producing new gas that isn’t already being marketed.
Below is a table of estimated future production by region based on the average monthly number of rigs by basin this year:

In summary, not all drilling rigs produce the same volume of a commodity. In fact, a large chunk of new natural gas that can be expected to arrive in the future is likely via associated natural gas from several oil-directed rigs in the Permian and Eagle Ford basins. However, the comparatively low volume of associated gas per rig out of each of these regions is multiplied by a much larger number of rigs, contributing significantly to the expected growth of natural gas in the future.
So, what happens to natural gas growth if oil demand continues to decline along with the price of crude when so much of the associated natural gas growth in the U.S. is tied to profitable oil prices? That’s a topic for a future article.
